James Domino
Day 2 Range Break • Oversold Bounce at Lower Bollinger Band
QQQ rallied +3.4% off the lower BB after a 5-day selloff
Please note that the prices and other statistics on this page are hypothetical, and do not reflect the impact, if any, of certain market factors such as liquidity, slippage, and commissions.
QQQ VWAP PULL-IN • VWAP-PULL-IN
BIGGER PICTURE
$QQQ
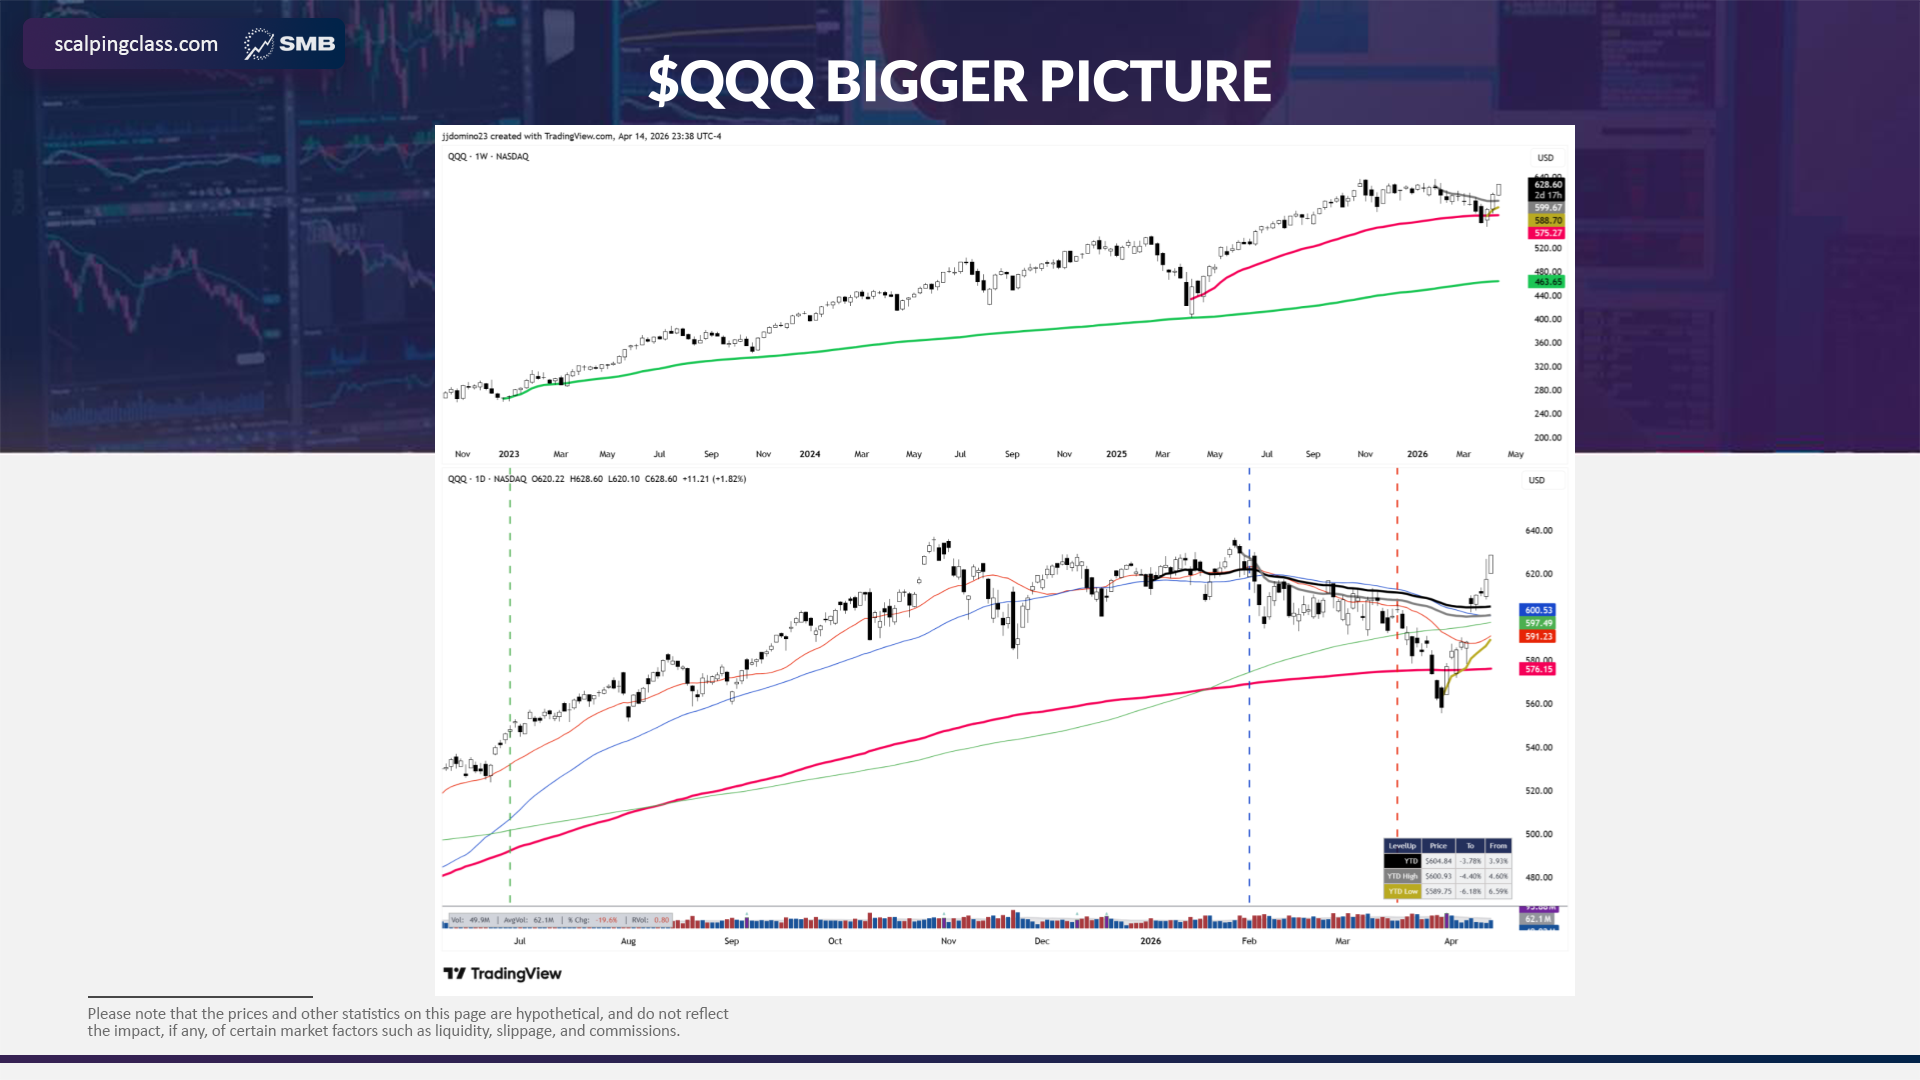
Starting back in 2023, QQQ put in a low and held the AVWAP from that level. Price bounced off this in 2025 on the April 4th low
Price recently undercut this VWAP handoff from 4/4/25 low
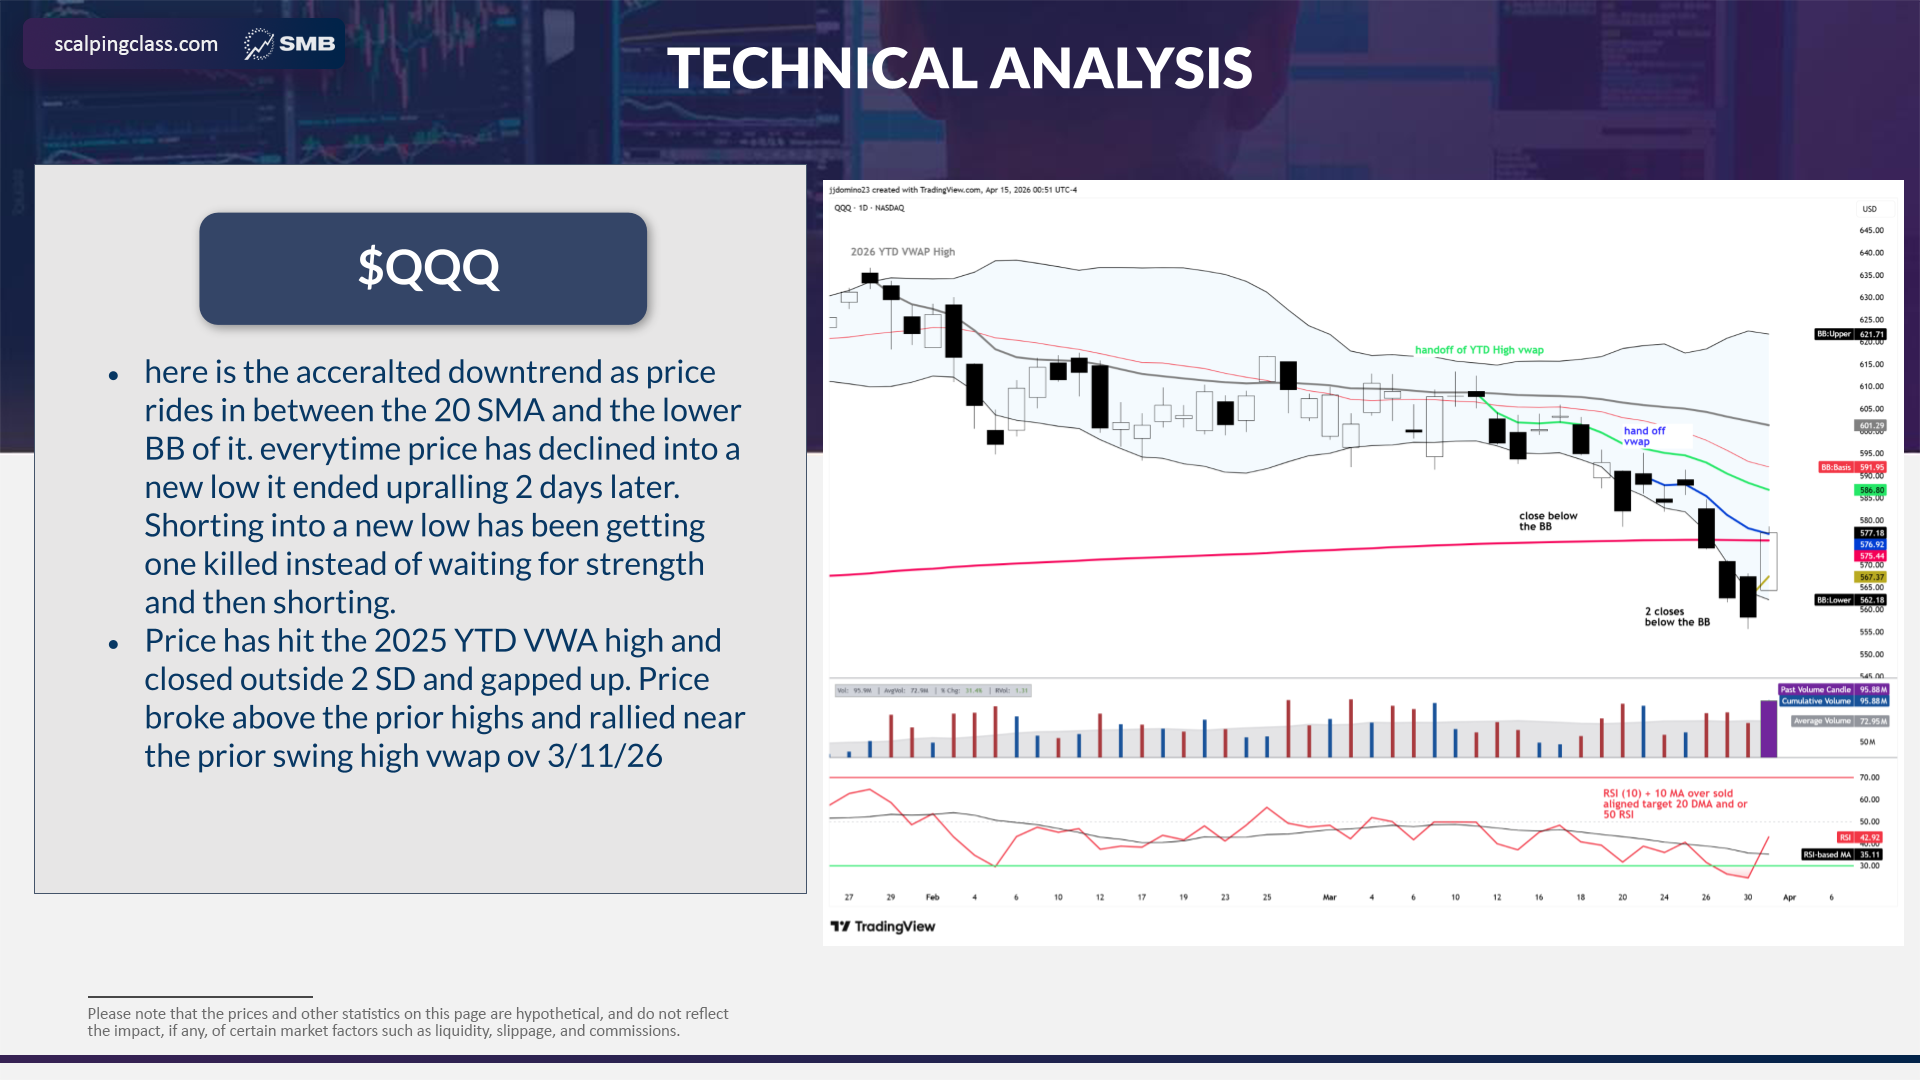
Accelerated downtrend as price rides between the 20 SMA and Lower BB — every time price declined into a new low, it ended up rallying 2 days later
3/20: First close below the Lower Bollinger Band — the initial signal of overextension
3/26–3/28: Three consecutive closes below the Lower BB — extreme overextension, a rare event that historically precedes mean reversion
3/31: Opened at 564.29 (still below BB at 561.41), rallied to 578.64, closed 577.18 (+3.4%). Price reverted back toward the 20 DMA
4/6: Mean reversion target hit — price reached the 20 DMA and retested the handoff AVWAP from 3/23
Price hit the 2025 YTD VWAP high, closed outside 2 SD, gapped up, broke above prior highs and rallied near prior swing high VWAP of 3/11/26
$SPY
Starting from left to right in 2025, the purple VWAP high is noted — V bottom put in after. That leads to mid-May where the 2025 VWAP was reclaimed
Price put in a high on 1/28/26 and sold off into the 2025 VWAP high. Market undercut the VWAP from 4/14/26
Price reclaimed it and traded above the prior 2 day highs, filled the gap, and has dug into a potential V bottom formation since this day
3/31 was a massive reversal day: opened 638.94, rallied to 651.54 (+2.9%). Volume surged to 153M shares (70% above 20-day average)
$VIX
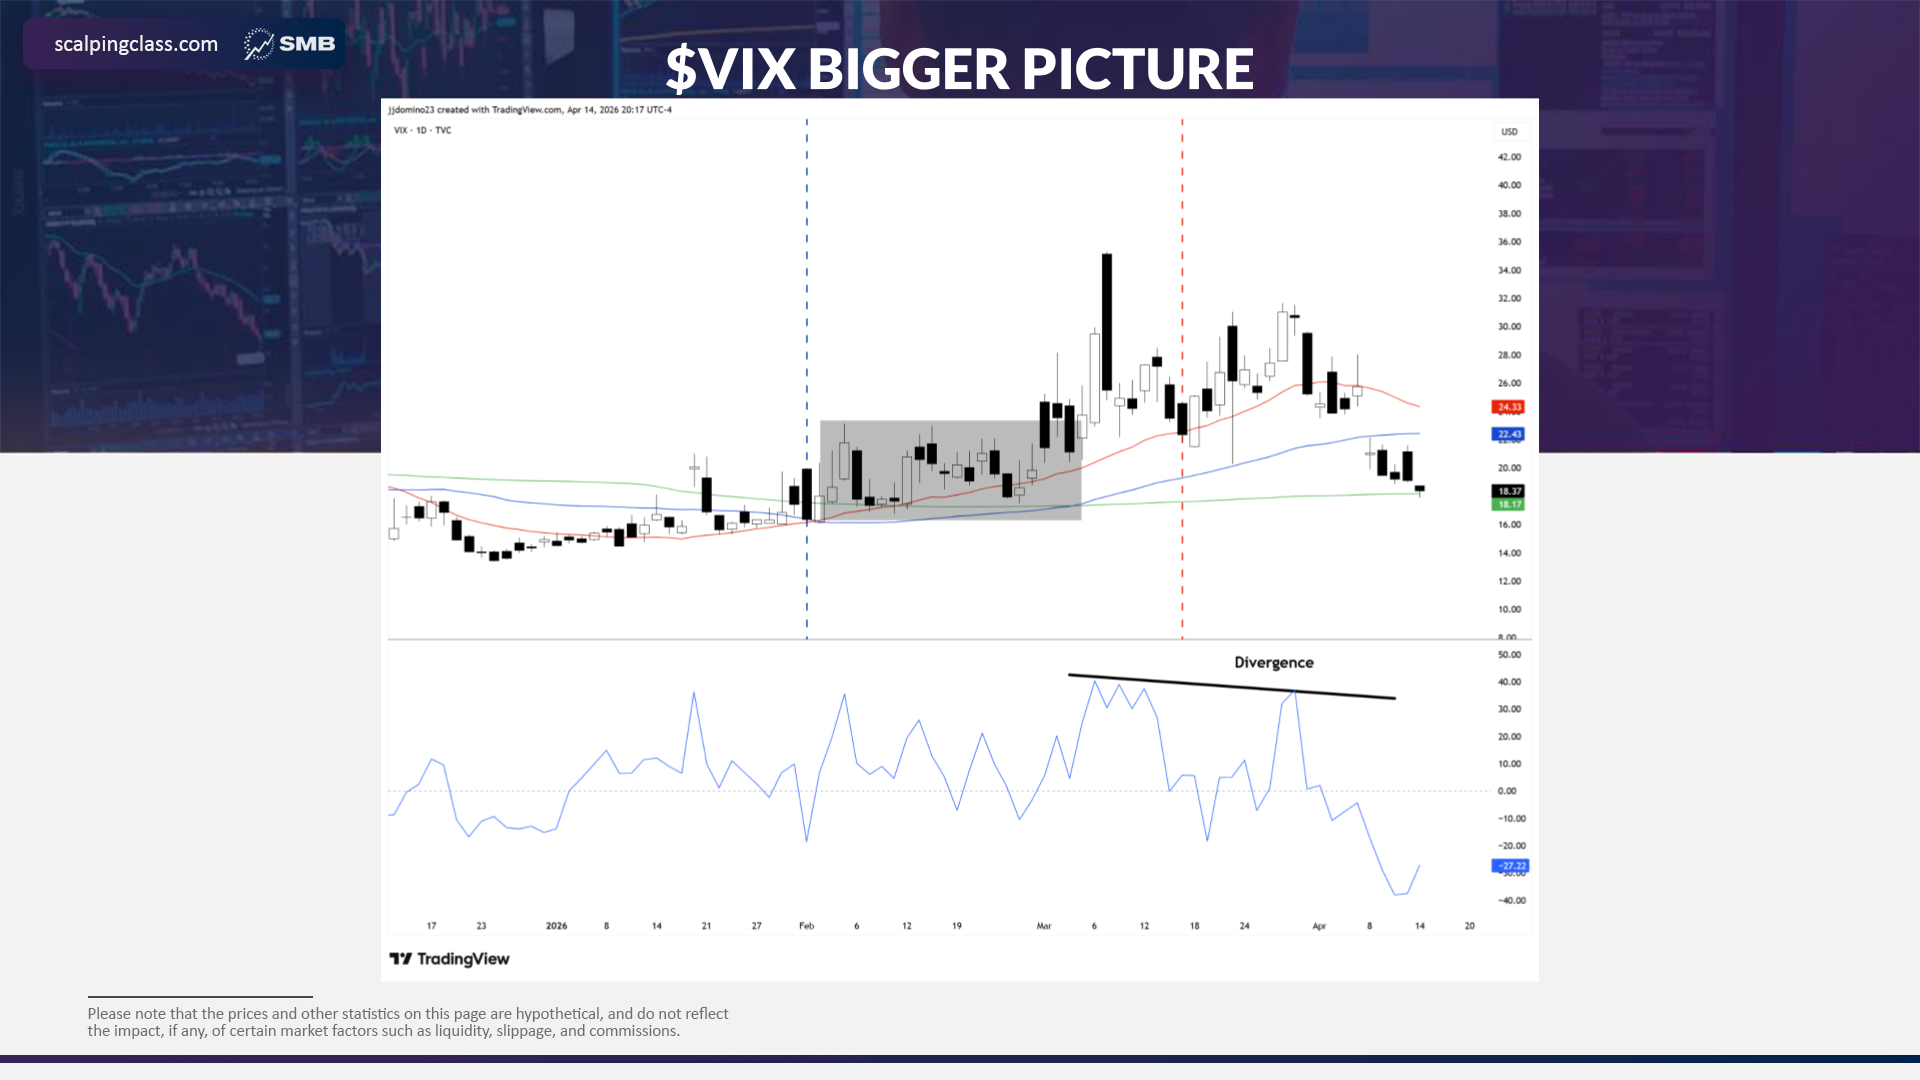
VIX has consolidated for the month of March and actually started to break and trend. VIX is usually a mean-reverting instrument
VIX is elevated — rallied into March into the 30s, rallied 2 times into 30 and just above, then gapped and rolled over
Closed under the 20 DMA for the first time since 3/17 and then 2/26
UVXY collapsed from 56.55 to 52.30 (−14%) — fear unwinding = risk-on signal
5-Day Selloff into 3/31
Date
Open
High
Low
Close
Vol
Chg
2026-03-24
584.81
587.93
581.93
583.98
58M
-0.68%
2026-03-25
589.14
591.37
585.69
587.82
60M
+0.66%
2026-03-26
582.60
584.63
573.43
573.79
81M
-2.39%
2026-03-27
570.81
571.02
561.57
562.58
83M
-1.95%
2026-03-30
567.38
568.05
555.60
558.28
71M
-0.76%
2026-03-31
564.29
578.64
564.21
577.18
96M
+3.39%
Please note that the prices and other statistics on this page are hypothetical, and do not reflect the impact, if any, of certain market factors such as liquidity, slippage, and commissions.
QQQ VWAP PULL-IN • VWAP-PULL-IN
HIGHER TIMEFRAME ANALYSIS
Weekly Chart Context
AVWAP from 2023 Low (Green): QQQ held the anchored VWAP from the Oct 2023 low — a level of demand since 2023. Price pulled right to it in April 2025 and rallied from there
Handoff VWAP: We anchor a “handoff” VWAP at the 4/4/25 rally point. Price has recently undercut this handoff VWAP — this is where there “could be a level of demand”
V Bottom Setup: With the news catalyst, price has put in a potential V bottom off the handoff VWAP undercut. The weekly structure shows demand stepping in at the same AVWAP zone that held in 2025
Volume Profile: High volume node at 560–565 range = institutional accumulation zone at the handoff level
Daily Chart Structure
Accelerated Downtrend: Price riding between 20 SMA and Lower BB — classic “walking the band” pattern (Bollinger)
BB Breakdown Sequence: First close below BB on 3/20. Price moved sideways, then 3/26–3/28 broke down with 3 consecutive closes below the Lower BB — extreme overextension
Every new low rallied 2 days later: Pattern of lower lows followed by 2-day bounces. 3/31 was Day 2 of this pattern
BB Squeeze Potential: BB Width at 10.32% with price at lower band. Mean reversion target = SMA(20) at 591.45
Gap Up on 3/31: Opened 564.29 (above prior close 558.28) — gap into prior day’s range. Hit 2025 YTD VWAP high, closed outside 2 SD, broke prior highs and rallied near prior swing high VWAP of 3/11/26
Mean Reversion Confirmed (4/6): Price reverted to the 20 DMA and retested the handoff AVWAP from 3/23 (blue) — textbook mean reversion from a 3-close BB extreme
$VIX Analysis (CMT Ch. 24)
VIX as Contrarian Indicator: Per Rhoads (CMT), buying S&P when down 1%+ AND VIX up 3%+ yielded 1,060 S&P points vs 921 without the VIX filter. VIX confirms real capitulation vs normal dips
Mean-Reverting Instrument: VIX consolidated in March and started to trend — unusual regime. Rallied to 30+ twice, then gapped and rolled over
Key Signal: Closed under the 20 DMA for the first time since 3/17 and 2/26. When VIX breaks below its 20 DMA after elevated readings, it signals the fear unwind is underway
UVXY Confirmation: UVXY collapsed −14% on 3/31 — structural fear unwind, not a dead-cat bounce
$PCC Analysis (CMT Ch. 24)
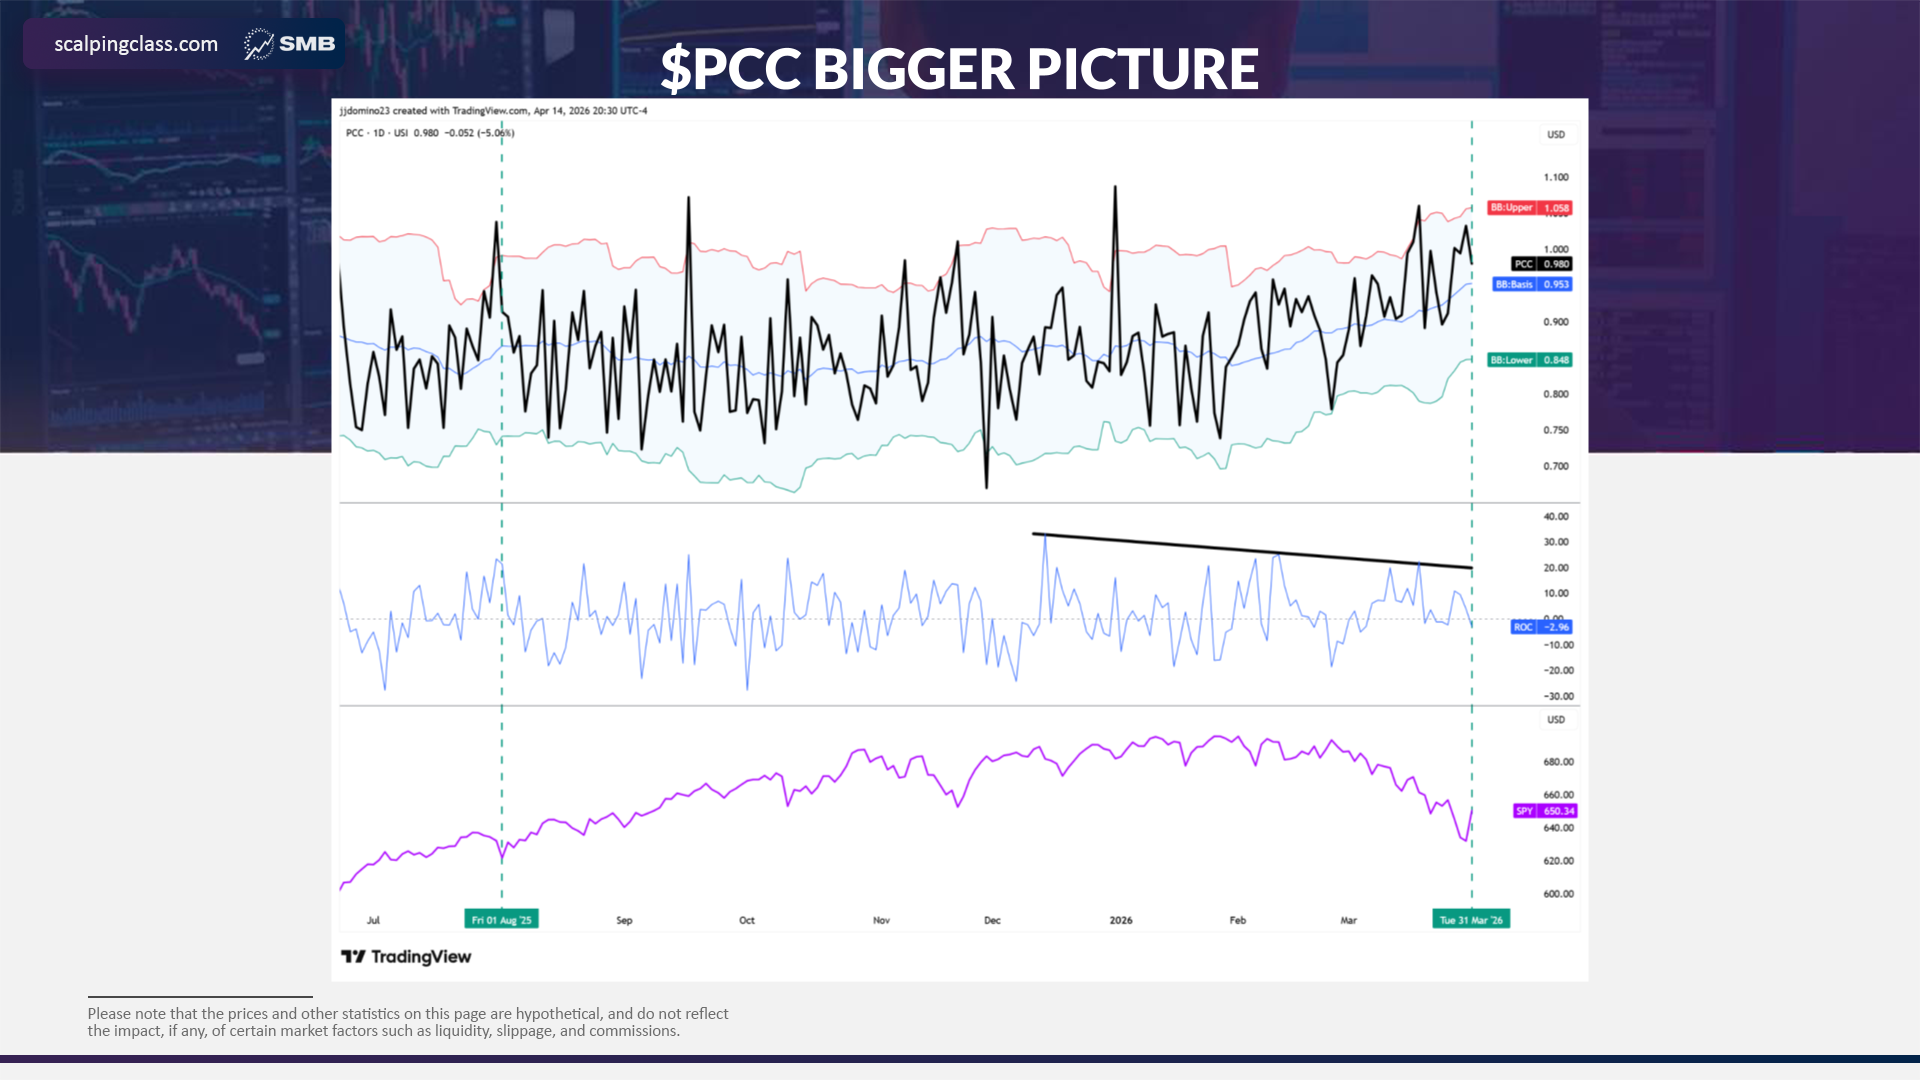
PCC at 2 SD: The equity put/call ratio hit 2 standard deviations above its mean heading into 3/31 — a rare contrarian buy signal indicating peak hedging activity
Sentiment Extreme (CMT): Extreme PCC readings reflect retail and institutional hedging at a peak. This historically precedes sharp short-covering rallies as protective puts expire and dealers unwind delta hedges
Double Confirmation: PCC at 2 SD + VIX at 28+ rolling over = both sentiment instruments signaling capitulation simultaneously. This dual-confirmation strengthens the oversold bounce thesis
Mechanical Unwind: At extreme PCC readings, dealers are heavily short delta from selling puts. As fear subsides and puts are closed or expire, dealers must buy back stock to flatten their hedge — this forced buying creates upward pressure independent of directional conviction
SPY Higher Timeframe
2025 VWAP Context: Purple VWAP high noted from left to right. V bottom put in after, leading to mid-May 2025 VWAP reclaim
1/28/26 High to Selloff: Price put in high on 1/28/26, sold off into 2025 VWAP high. Market undercut the VWAP from 4/14/26
3/31 Reclaim: Price reclaimed and traded above prior 2-day highs, filled the gap, dug into potential V bottom formation
SPY AVWAP from All-Time High: This VWAP acts as dynamic resistance on the way back up. 3/31 pushed into this level
Please note that the prices and other statistics on this page are hypothetical, and do not reflect the impact, if any, of certain market factors such as liquidity, slippage, and commissions.
QQQ VWAP PULL-IN • VWAP-PULL-IN
RSI MEAN REVERSION EDGE
CMT Framework — Chapter 7: Momentum & Oscillators
RSI as Mean-Reversion Signal: Per Kaufman (Trading Systems and Methods, 5th Ed), momentum oscillators are used as leading indicators. When RSI reaches extreme levels, a countertrend reversal is imminent
RSI(10) Hit Both Boundaries: During the 3/27–3/30 selloff, RSI(10) dropped to 28.5 then 19.7 — below the static 30 oversold level AND simultaneously hitting its own 2 SD lower Bollinger Band. The 10-period MA of RSI also tagged this lower boundary — double confirmation of extreme oversold conditions
RSI Break Back Above 30 = Confirmation: Per Kaufman (Ch. 7), when RSI breaks back above the oversold threshold after an extreme reading, this confirms the reversal is underway. On 3/31, RSI(10) crossed back above 30, providing buy confirmation aligned with the price bounce
Countertrend Rules (Ch. 7): When RSIt − RSIt-k < −a (a threshold), buy signal triggers. Exit when momentum returns to near zero or after n days
Mean Reversion Target: Price reverted to the 20 DMA by 4/6 — the textbook mean reversion target from a lower BB extreme
Overextension System — The Inverse Setup
Your Overextension Playbook (built for shorts) uses a two-timeframe confluence: daily macro overextension + 65-min execution via FL2
Daily Permission Structure: 20-bar range breakout, blow-off volume (7x+ RVol), price at 4 SD of 20 DMA, RSI(10) breaking its own 2 SD BB, then rejection candle
3/31 QQQ was the MIRROR IMAGE: First BB close on 3/20, then 3 consecutive closes below BB (3/26, 3/27, 3/30), RSI(10) hitting both 30 and its own 2 SD lower BB, then a reversal candle on 3/31 with RSI breaking back above 30
Key Insight: The same quantified overextension logic that identifies short setups can be inverted to identify oversold bounce setups. The RSI BB penetration works both ways
Sentiment Alignment — VIX + PCC Confluence
Triple Confirmation on 3/31: RSI(10) at oversold extreme + VIX closing below 20 DMA + PCC at 2 SD = three independent contrarian signals firing simultaneously
CMT Framework (Ch. 24): Sentiment indicators are most useful at extremes. The combination of price-based (RSI), volatility-based (VIX), and options-based (PCC) signals creates a multi-factor oversold screen that reduces false signals
VIX Divergence = Bottoming Signal: Price making new lows while VIX fails to make new highs is a classic bottoming pattern. VIX futures discount (below spot) historically averaged +4.84%/yr long S&P
Actionable Takeaway: When all three align at extremes, the edge is in the oversold bounce. The question is not IF but HOW to enter — which is where the VWAP band strategy provides the execution framework
Post-Reversal: RSI Journey (3/31 → 4/15)
3/30: RSI 19.7 — Extreme oversold, hitting both 30 level and lower 2 SD of RSI BB simultaneously. Deepest reading in this selloff
3/31: RSI 34.9 — Break back above 30 on the bounce day = buy confirmation per Kaufman’s countertrend framework (Ch. 7)
4/6: RSI 54.8 — RSI retested and crossed above the 50 boundary = trend confirmation. The 50 level separates mean-reverting bounces from sustained trend moves. Crossing above 50 signals the move is no longer just a bounce — it’s becoming a trend
4/10: RSI 77.3 — Approaching overbought territory. RSI now near the upper 2 SD of its own Bollinger Band
4/14: RSI 100.0 — Extreme overbought at upper 2 SD BB. Price closed above the upper Bollinger Band (628.60) on 4/14. The same overextension signal that flagged the bottom is now flagging the top of the move
Full Cycle: Lower 2 SD BB → Break > 30 → 50 Trend Confirm → Upper 2 SD BB. The entire Kaufman mean-reversion and momentum framework played out in 11 trading days
Please note that the prices and other statistics on this page are hypothetical, and do not reflect the impact, if any, of certain market factors such as liquidity, slippage, and commissions.
QQQ VWAP PULL-IN • VWAP-PULL-IN
INTRADAY FUNDAMENTALS
Setup Context
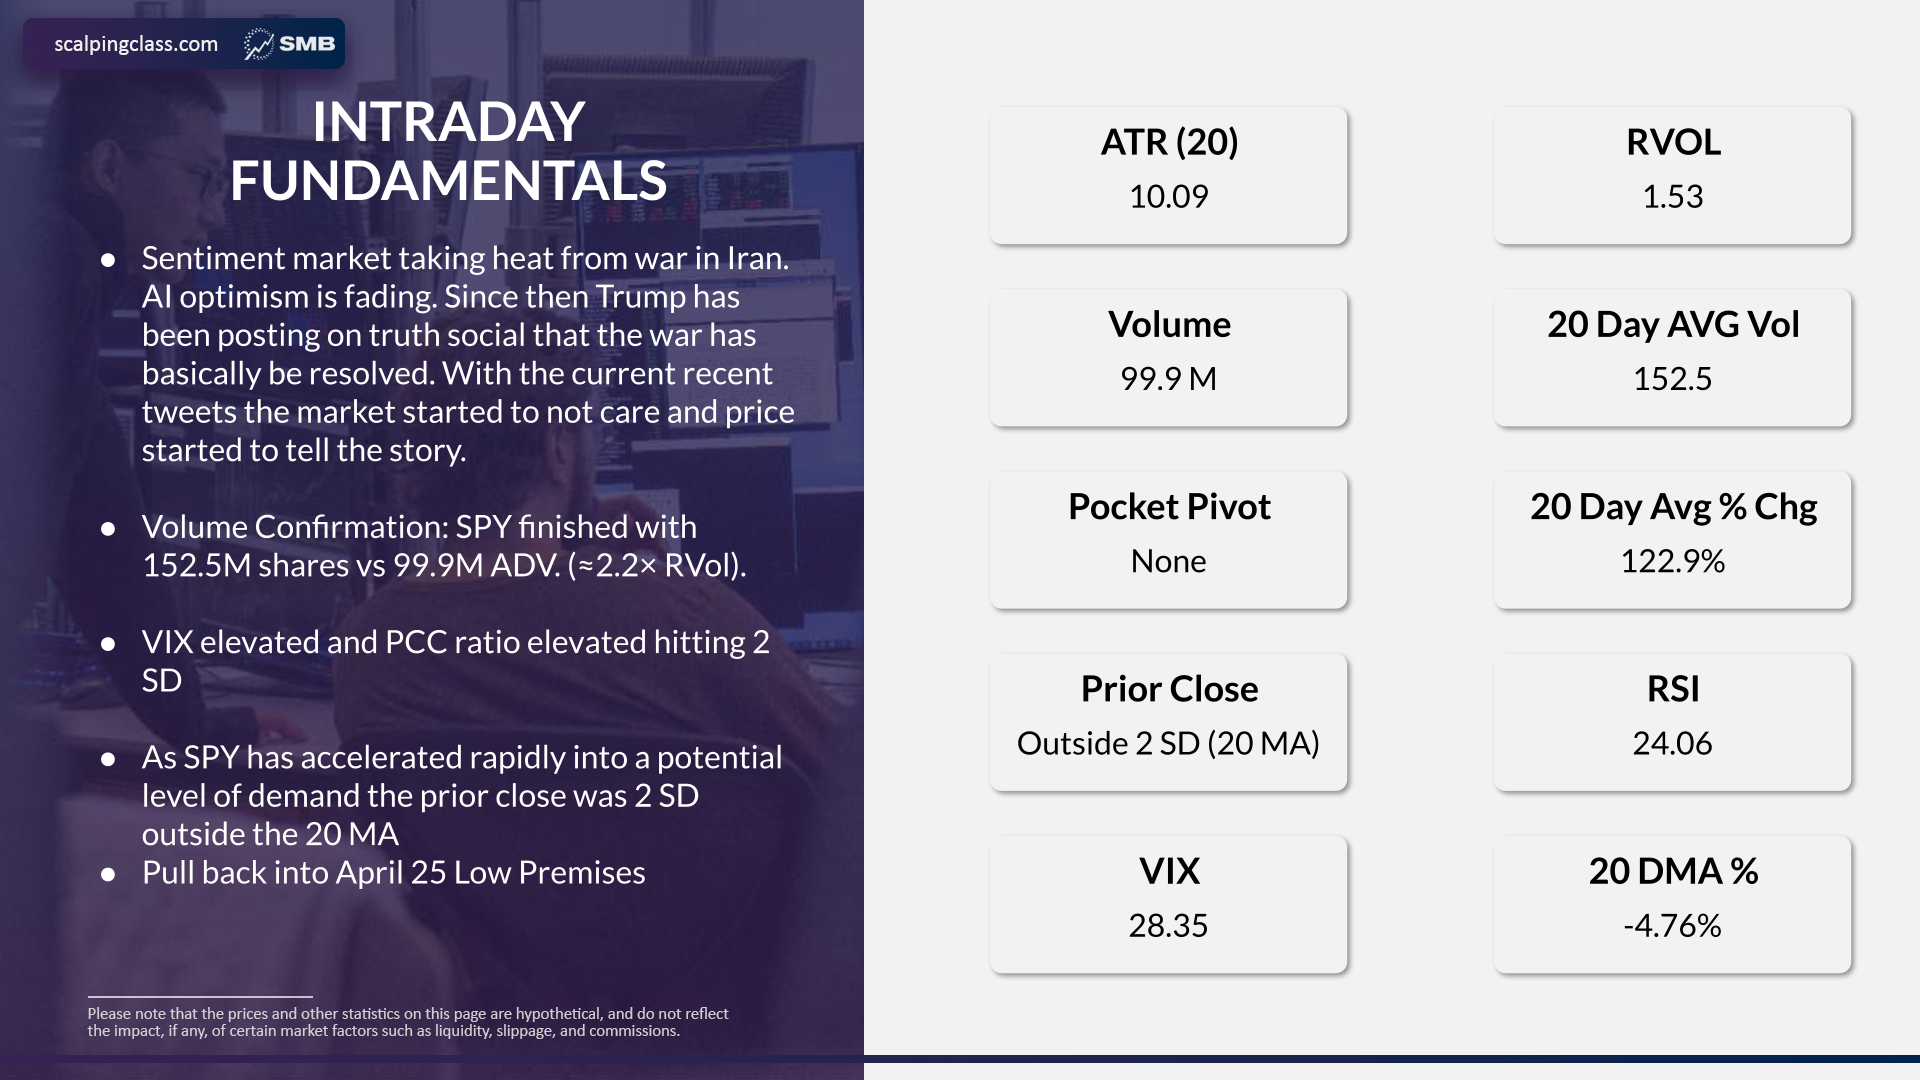
Sentiment: Market taking heat from war in Iran. AI optimism fading. Since then Trump has been posting on Truth Social that the war has basically been resolved. With the current recent tweets the market started to not care and price started to tell the story
Volume Confirmation: SPY finished with 152.5M shares vs 99.9M ADV (≈2.2x RVol). QQQ: 96M shares vs 72M avg (RVOL 1.34x)
VIX & PCC: VIX elevated and PCC ratio elevated hitting 2 SD
Oversold Signal: SPY has accelerated rapidly into a potential level of demand — prior close was 2 SD outside the 20 MA. Pull back into April 25 Low Premises
Key Statistics
11.04
ATR (20)
1.34x
RVOL
96M
Volume
72M
20-Day Avg
-2.4%
20 DMA %
24.06
RSI
Outside 2 SD
Prior Close
28.35
VIX
Please note that the prices and other statistics on this page are hypothetical, and do not reflect the impact, if any, of certain market factors such as liquidity, slippage, and commissions.
QQQ VWAP PULL-IN • VWAP-PULL-IN
TECHNICAL ANALYSIS — DAILY
QQQ Daily — Bollinger Bands (20, 2) + SMA 20/50/200
RSI(10) + 10 MA — Mean Reversion to 50 / 20 DMA Alignment
SMA(20) / Upper BB
Lower BB
SMA(50)
SMA(200)
RSI(10)
RSI 10 MA
Bollinger Bands (20, 2) — 3/31/26
SMA(20)
591.45
Upper BB
621.40
Lower BB
561.51
BB Width
10.13%
%B (Position)
26.2%
RSI(10)
34.93
20 DMA %
-2.41%
BB + RSI Alignment
2 closes below the Lower BB — prior day (3/30) close at 558.28 was BELOW the LBB, confirming oversold extreme
RSI(10) at extreme oversold — aligned with target at 20 DMA. As RSI reverts toward 50, price reverts toward the 20 DMA at 591.45
RSI 10 MA cross: The 10 MA of RSI acts as a smoothing filter. When RSI crosses above its 10 MA from oversold, it confirms the reversal
BB Width at 10.32% = elevated volatility (bands widening from selloff). Mean reversion target is SMA(20)
Every new low into the LBB rallied 2 days later — 3/31 was Day 2 of this pattern
Please note that the prices and other statistics on this page are hypothetical, and do not reflect the impact, if any, of certain market factors such as liquidity, slippage, and commissions.
QQQ VWAP PULL-IN • VWAP-PULL-IN
INTERMEDIATE TIMEFRAME — 15-MIN
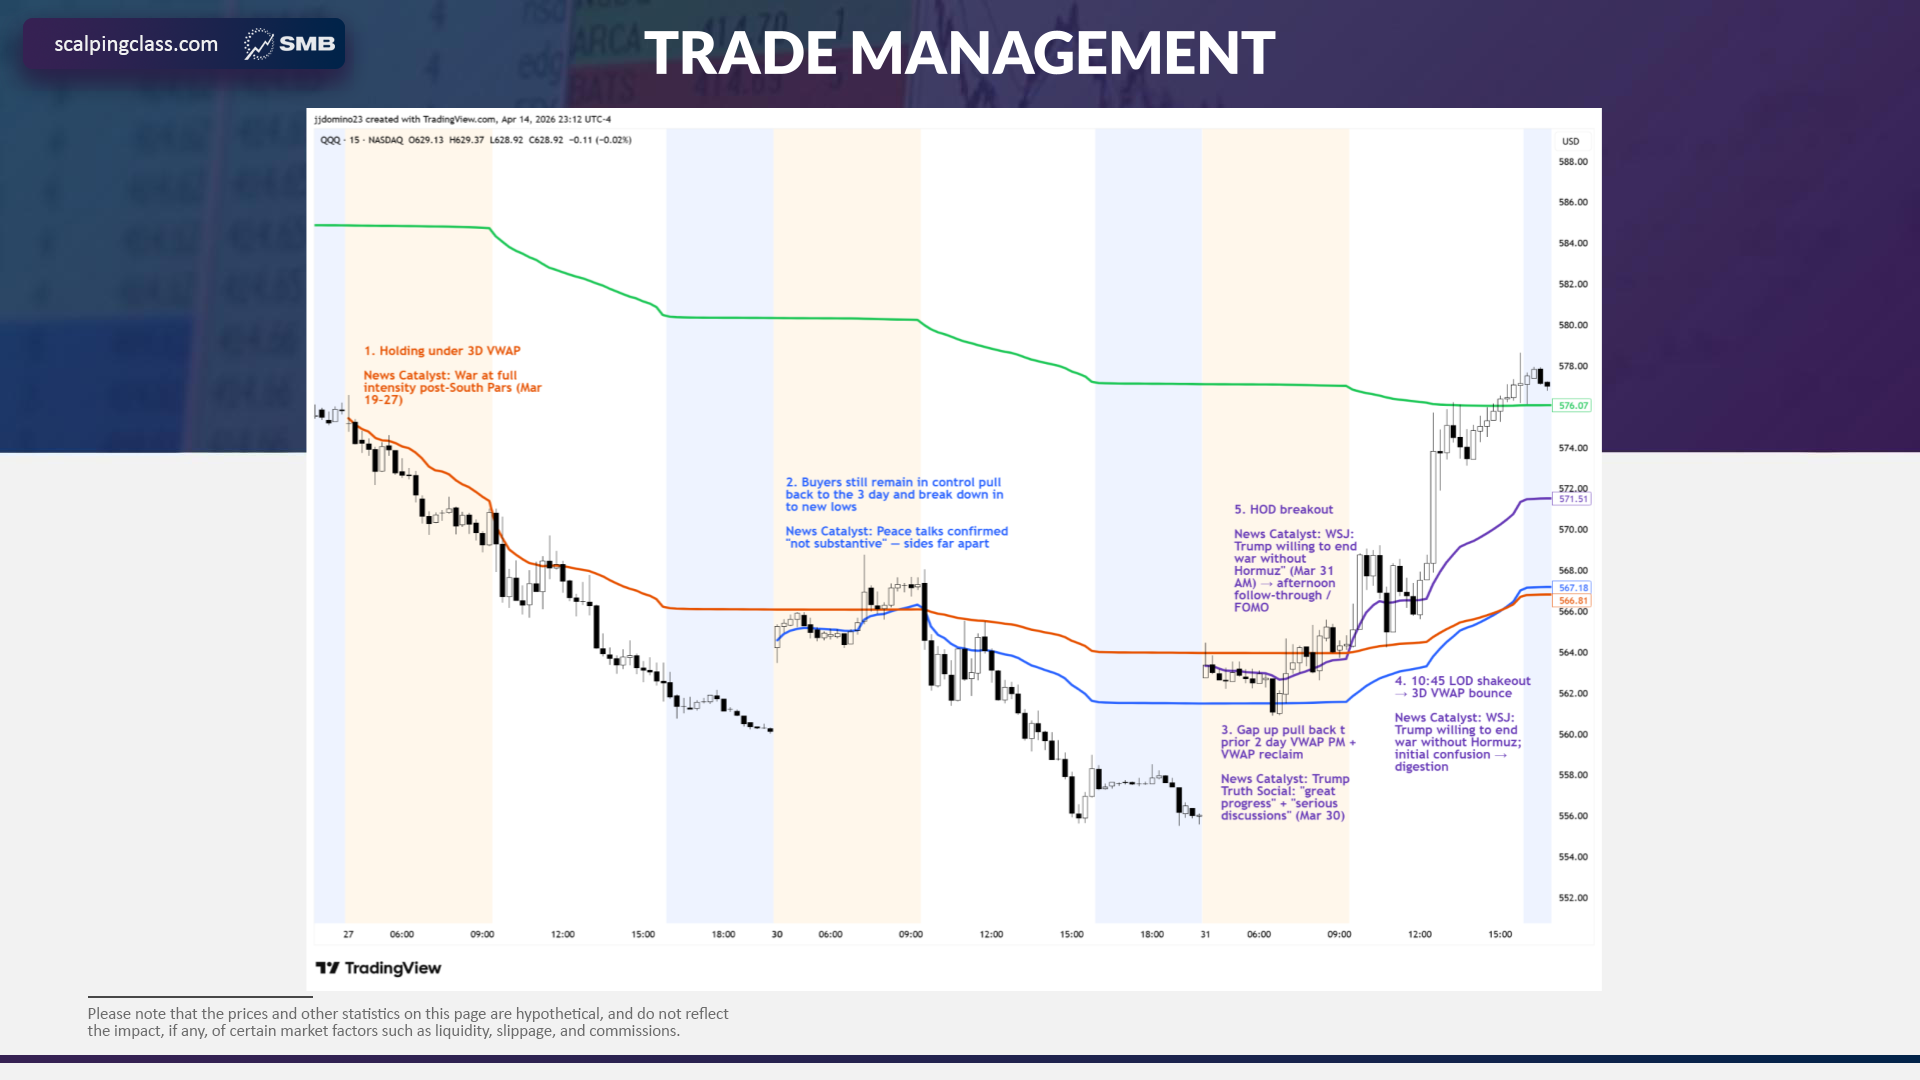
News Catalysts Driving 3/31 Price Action
PRE-MKT Trump Truth Social — “great progress” / “serious discussions” → gap up setup
9:30–10:30 Headlines re: war, Iran, death toll → morning chop under 3D VWAP, PDH rejection
12:00–13:30 WSJ — Trump willing to end war without Hormuz → VWAP reclaim 12:14 → PDH break → HOD run
13:30–16:00 Afternoon follow-through / FOMO → blasts to 578 near 3/27 swing-high VWAP
QQQ 15-Min — 3/31/2026 | Key Levels + VWAP Bands
PDH (568.05)
VWAP
Band 3 (3 SD)
QQQ 1-Min Intraday — 3/31/2026
15-Min Structure
9:30–10:15: First 3 bars test PDH (568) from below. Upper shadows = selling pressure at that level
10:15–11:45: Rotation phase. Price oscillates between VWAP and PDH. Bars small-bodied = indecision. VWAP bands flat
12:00–12:30: THE BAR — 15-min candle breaks and holds above PDH. Volume spike confirms institutional participation
12:30–14:00: Trend bars — consecutive higher lows on 15-min. No bar closes below PDH after the break. VWAP bands fanning
14:00–16:00: Continuation to 578.64 HOD. Each 15-min bar holds above prior bar’s midpoint = strong trend
Intraday Structure + News Alignment
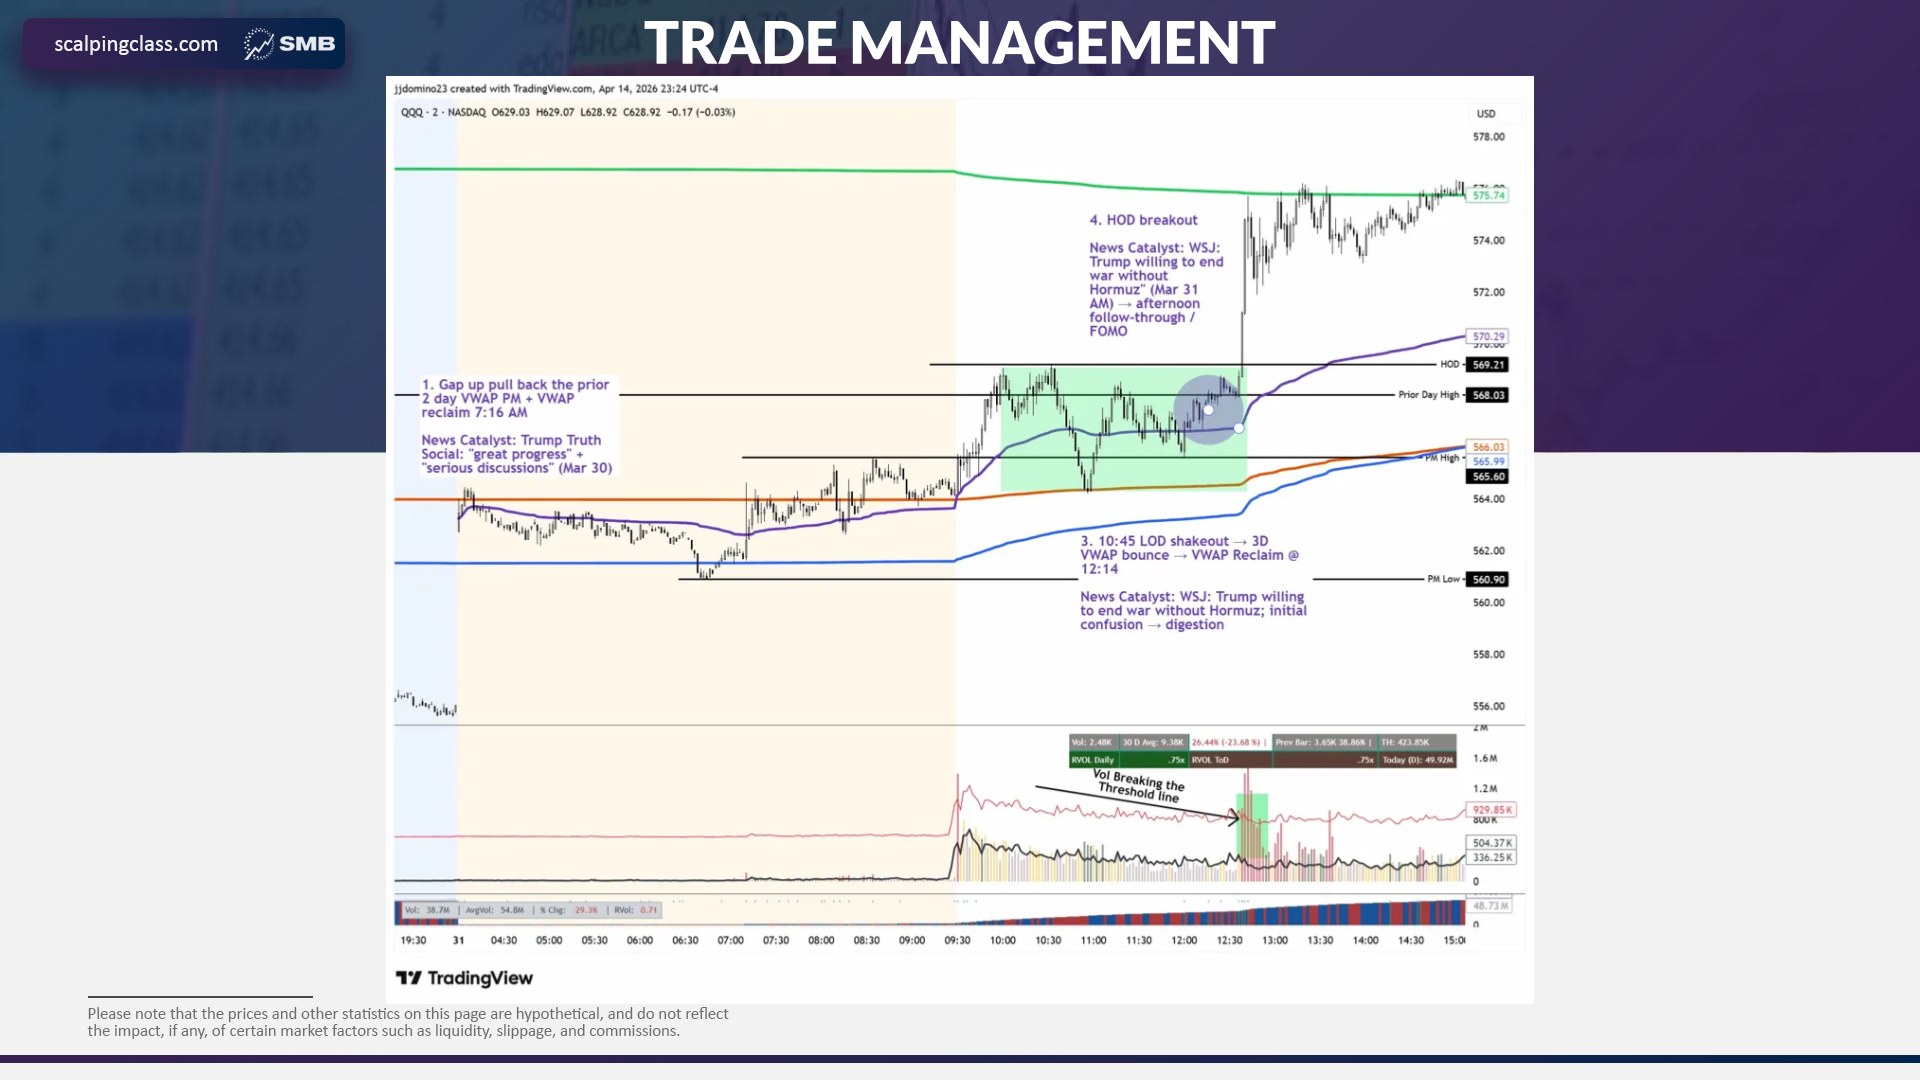
Pre-market: Gap up, pull back to prior 1-day VWAP PM, VWAP reclaim at 7:14 AM. Trump “great progress” / “serious discussions”
9:30–10:30: Chop 564–569. PDH (568) rejected. Holding under 3D VWAP. War / Iran / death toll headlines
10:30–12:00: 10:45 LOD shakeout → 3D VWAP bounce. Pull back to prior 2-day VWAP. Flat VWAP bands = rotation regime
12:00–13:30: VWAP reclaim at 12:14. HOD breakout. WSJ — Trump willing to end war without Hormuz
13:30–16:00: Breaks intraday range + 2-day highs. Blasts to 578 near prior swing-high VWAP from 3/27/26
Please note that the prices and other statistics on this page are hypothetical, and do not reflect the impact, if any, of certain market factors such as liquidity, slippage, and commissions.
QQQ VWAP PULL-IN • VWAP-PULL-IN
BREAK OF PRIOR DAY HIGHS
QQQ 1-Min — Prior Day High (568.05) = Key Level | Orange = PDH | Dashed = 2-Day High (571.02)
Prior Day High (568.05)
2-Day High (571.02)
Prior Day Close (558.28)
The Setup: Day 2 Range Break
Prior Day High = 568.05 (3/30/26). This was THE level. QQQ sold off 5 days and closed at 558.28 — well below PDH
3/31 Open = 564.29: Gapped up +1.1% but still BELOW prior day high. Gap into prior day’s range = potential reclaim
Morning Chop (9:30–12:00): Price tested 568 (PDH) multiple times and got rejected. This is where most of my 13 AM trades happened — buying into resistance
The Break (12:14): Price reclaimed 568.05 with volume. VWAP band strategy entered at 567.74 (just below PDH). Once PDH broke, price never came back
Continuation to 2-Day High: After clearing PDH (568.05), price ran to 571.02 (2-day high from 3/27), then to 575+ as the range expanded
HOD Breakout: Final leg to 578.64 near the prior swing high VWAP from 3/11/26
What Bella Will Focus On
The IF/THEN was clear: IF price breaks above PDH (568.05) with volume → THEN buy the reclaim for continuation to 2-day highs and gap fill
Patience was required: PDH didn’t break until 12:14 PM. Morning was all rotation below that level
Risk was defined: Entry near 567.74, stop below LB1 at ~566.46. Risk = $1.28/sh for a move to 574+ = 5:1 R:R
My mistake: I took 13 trades BEFORE the break trying to front-run it. The playbook says wait for the break, then enter with size
Lesson: The prior day high is not just a level — it’s a binary trigger. Below it = rotation, choppy. Above it = trend, add size, trail wide
Please note that the prices and other statistics on this page are hypothetical, and do not reflect the impact, if any, of certain market factors such as liquidity, slippage, and commissions.
QQQ VWAP PULL-IN • VWAP-PULL-IN
TRADE STRATEGY
QQQ — A+
Catalyst:
Technical: QQQ coming off an oversold multi-day selloff, gapping up into the open. Price setting up for a Gap-Give-Go bounce with potential to reclaim prior highs. The daily and 2-day VWAP were key magnets for price to consolidate before continuation
Macro backdrop: Tariff-driven volatility had created an extended oversold condition. A mean reversion bounce was overdue, with institutional participants looking for a low-risk entry on a VWAP reclaim setup rather than chasing the gap open
Daily Setup: Gap Give Go — Oversold Bounce / Break of Prior Highs
Key Levels:
2-Day VWAP
Daily VWAP
Prior Day High/Low
PM High/Low
Gap Fill Target (upside)
LOD
IF/THEN Scenarios
If price pulls back into 2-Day VWAP: Do not chase the gap. Wait for the Gap-Give-Go setup. Monitor for price to put in a low and speed into a consolidation at VWAP
If tape is strong — ticks high, VIX down, high volume: Monitor for a Fashionably Late entry to trade into the highs
If price trades into the highs: Monitor for momentum continuation, a break of prior highs, and a gap fill to the upside
If price breaks LOD: Trade is broken. Price is poised to fill the gap and trade back below the Daily and 2-Day VWAP
Risk Management:
Stop: Below VWAP Lower Band 1 (LB1) = −$0.75 to −$1.80/sh risk
Target: UB3 (+$5.75/sh) or trend trail via 4 EMA (+$6.79/sh)
R:R: Risking ~$1.28 avg to make ~$6.79 = 5.3:1
Please note that the prices and other statistics on this page are hypothetical, and do not reflect the impact, if any, of certain market factors such as liquidity, slippage, and commissions.
QQQ VWAP PULL-IN • VWAP-PULL-IN
TRADE MANAGEMENT
Playbook #1: VWAP Pull-In
Entry: VWAP to Band 1 (−0.5 SD) — buy the pullback to VWAP after directional move
Stop: LB1 (−0.5 SD below VWAP)
Target: Band 3 (+2 SD from VWAP)
Risk: ~$0.41/sh at 10:16 SD, ~$0.51/sh at 12:14 SD
Core bread-and-butter setup. Most of my 22 entries should have been graded against this playbook
Playbook #2: FL2 (Fashionably Late V2)
Signal: EMA(4) on 2-min crosses above/below VWAP
Confirmation: Price pushes to Band 2 (+1 SD) confirming momentum
Entry: Pullback to Band 1 (+0.5 SD from VWAP)
Exit: 50% at Band 3 (+2 SD), trail remaining 50% with multi-band trail (tight/mid/wide)
Stop: LB1 (−0.5 SD) or trend break
On 3/31: FL2 triggered only 3 times because it requires the full EMA4 cross → Band 2 push → Band 1 pullback sequence
10:16 → 10:44 ETLOSSROTATION
EMA4 crossed VWAP → pushed to UB2 (568.78) → entered 568.27 on pullback. Stopped at LB1 (566.46) −$1.81/sh — Entry was extended above bands. EMA 9 rejected from +5.9° to −16.3°. Rotation regime = no follow-through.
2
11:40 → 11:46 ETLOSSROTATION
EMA4 recrossed VWAP → entered 566.99 (near VWAP 566.87). Stopped at LB1 (566.24) −$0.75/sh — Flat bands (UB1 slope +1.75°), tight risk. Small defined loss = correct behavior.
3
12:14 → 13:26 ETWINROTATION → TREND
EMA4 crossed VWAP → pushed through UB1 (567.48) → entered 567.74 on confirmation. TP1 hit UB3 at 573.49 (+$5.75/sh), trailed remainder to trend break at 574.53 +$6.79/sh — Bands expanded from 2.42 pts to 7.03 pts (VWAP SD doubled). Captured 83% of the move to HOD.
FL2 net result: −$1.81 −$0.75 +$6.79 = +$4.23/sh on 1 share per signal. Win rate: 33% but R:R of 5.3:1 makes it profitable.
Please note that the prices and other statistics on this page are hypothetical, and do not reflect the impact, if any, of certain market factors such as liquidity, slippage, and commissions.
Please note that the prices and other statistics on this page are hypothetical, and do not reflect the impact, if any, of certain market factors such as liquidity, slippage, and commissions.
QQQ VWAP PULL-IN • VWAP-PULL-IN
TRADE REVIEW
What I Did Well
Identified the correct macro thesis: oversold bounce on fear extreme (UVXY at 62) with volume confirmation
Was in the market and participating on the right day — 3/31 was a +3.4% day in QQQ
Recognized the break of prior day highs (568) as a key level
What I Could Do Better
Overtrading: 22 QQQ trades for −$33.66 when FL2 took 3 trades and netted +$4.23/sh
OFF-BOOK entries: Most of my 22 entries didn’t match VWAP Pull-In or FL2 criteria — reactive/impulsive trading with no playbook backing
Morning chop: 13 of 22 trades before noon. FL2 also lost twice AM but with defined LB1 stops (−$1.81, −$0.75)
Sizing: Biggest QQQ position was 5 shares. When the PM trend hit, should have been in with conviction size
Fighting the tape: 14 of 22 trades lost. When morning wasn’t working, should have waited for band confirmation (12:14)
Next Time / Adjustment
Wait for FL2 signal or VWAP Pull-In setup: FL2 waited until 12:14 and caught the entire PM trend. VWAP Pull-In requires price at VWAP/Band 1 with LB1 stop defined before entry
SPY as leading indicator: SPY confirmed bounce at 12:06. QQQ FL2 entered 8 min later. Use SPY reversal as leading signal
Size up on conviction: After 2 failed FL2 attempts with small losses, the 3rd signal deserves FULL SIZE
Tag every trade ON-BOOK or OFF-BOOK: Match live executions against VWAP Pull-In / FL2 criteria in real-time. OFF-BOOK = automatic F grade
Please note that the prices and other statistics on this page are hypothetical, and do not reflect the impact, if any, of certain market factors such as liquidity, slippage, and commissions.
QQQ VWAP PULL-IN • VWAP-PULL-IN
SCORE CARD
−$33.66
My QQQ P&L
36.4%
Win Rate
0.47:1
Risk/Reward
22
Total Trades
+$6.79
FL2 Best Trade
5.3:1
FL2 R:R
Playbook Grading Categories (1–10)
Category
Grade
Notes
Big Picture
9
Correct macro thesis — oversold bounce at LBB with fear extreme
Intraday Fundamentals
8
Identified volume, VIX, and sentiment catalysts correctly
Stock Selection
7
QQQ was the right instrument for this oversold bounce
Technical Analysis
6
Recognized key levels but didn’t wait for confirmation
Trade Strategy
4
IF/THEN was correct but did not follow it — chased entries
Risk Management
3
Avg loss 2.9x band strategy’s avg loss. No defined stops
Reading the Tape
4
Did not read tape for confirmation before entries
Technology
8
VWAP band strategy signals were available and correct
Review: What Can You Do Better?
—
See Trade Review section above
Key Improvement Areas
Follow VWAP Pull-In or FL2 signals — both had defined rules that were right on this day
Reduce trade count from 22 to 3–5 ON-BOOK entries matching playbook criteria
Size up on 3rd FL2 signal after 2 small defined-risk losses
Use SPY correlation to time QQQ entries
Trail winners using Band 3 target + multi-band trail system
Please note that the prices and other statistics on this page are hypothetical, and do not reflect the impact, if any, of certain market factors such as liquidity, slippage, and commissions.
QQQ VWAP PULL-IN • VWAP-PULL-IN
PARAM SURFACE — RISK/REWARD MATRIX
VWAP Band Stop/Target Optimization — 3x4 Grid
If I enter at VWAP and risk to band X, what is the expected return targeting band Y? Based on the VWAP band geometry on 3/31/26.
Stop \ Target
UB2 (+1 SD)
UB3 (+2 SD)
UB4 (+3 SD)
UB5 (+4 SD)
LB1 (−0.5 SD)
Risk $0.41 Target $1.02 2.5:1 R:R
Risk $0.41 Target $2.04 5.0:1 R:R
Risk $0.41 Target $3.06 7.5:1 R:R
Risk $0.41 Target $4.08 10.0:1 R:R
LB2 (−1.0 SD)
Risk $0.82 Target $1.02 1.2:1 R:R
Risk $0.82 Target $2.04 2.5:1 R:R
Risk $0.82 Target $3.06 3.7:1 R:R
Risk $0.82 Target $4.08 5.0:1 R:R
LB3 (−2.0 SD)
Risk $1.64 Target $1.02 0.6:1 R:R
Risk $1.64 Target $2.04 1.2:1 R:R
Risk $1.64 Target $3.06 1.9:1 R:R
Risk $1.64 Target $4.08 2.5:1 R:R
Based on VWAP SD = $0.82 at 10:16 signal. Risk and target scale linearly with band width.
YES — QQQ hit 4+ SD of VWAP. Price reached 578.64 HOD, which was >4 SD above VWAP by close. The band strategy trailed to 574.53 and captured 83% of the move to UB3
Optimal combo on this day: LB1 stop / UB5 target = risking $0.41 to make $4.08+ = 10:1 R:R
CMT Connection (Ch 39)
Walk-Forward Optimization: The param surface is tested across rolling windows to ensure parameter stability (not overfitting to one day)
Robust Parameters: Tight stop (LB1) + wide target (UB4/UB5) works on trend days. On rotation days, wider stop (LB2/LB3) avoids whipsaws
Key Insight: On 3/31, the LB1_UB5 combo would have captured $4.08+/sh with $0.41 risk. That’s the power of aligning param surface with regime detection
Please note that the prices and other statistics on this page are hypothetical, and do not reflect the impact, if any, of certain market factors such as liquidity, slippage, and commissions.
QQQ VWAP PULL-IN • VWAP-PULL-IN
ME vs THE PLAYBOOKS
Metric
Me (Actual)
If I Used VWAP Pull-In Rules
FL2 Benchmark
Trades
22
22 entries, band stops
3 (only 3 triggered)
Shares
73
73 (same entries)
3 (1sh each)
Stop Rule
No defined stop
LB1 (−0.5 SD from VWAP)
LB1 (−0.5 SD)
Target Rule
No defined target
Band 3 (+2 SD) or trail
50% at Band 3, trail rest
Max Risk/Trade
−$8.05
−$0.41 to −$1.81
−$1.81
Avg Loser
−$3.73
≈ −$0.75 to −$1.28
−$1.28
Avg Winner
+$1.74
+$5.00+ (held to Band 3)
+$6.79
Total P&L
−$33.66
Significantly better
+$4.23/sh
R:R Ratio
0.47:1
3:1 to 5:1
5.3:1
Playbook Match
OFF-BOOK
VWAP Pull-In
FL2
Column 2: Same Entries + Discipline
If I entered at the same prices but applied VWAP Pull-In rules (LB1 stop, Band 3 target), my losses would be capped at $0.41–$1.81/sh instead of $3.73 avg. Winners would be held to Band 3 (+$5.75/sh) instead of cut at +$1.74. Same entries, defined risk = dramatically better P&L.
The problem wasn’t where I entered — it was that I had no stop rules and no target rules. Band risk management turns impulsive entries into structured trades.
Column 3: FL2 Was Selective
FL2 only triggered 3 times because it requires the full sequence: EMA4 cross → Band 2 push → Band 1 pullback. Most of my 22 entries didn’t meet those criteria — they were OFF-BOOK trades with no playbook backing them.
FL2 took 2 small defined-risk losses in rotation (−$1.81, −$0.75), then caught the entire PM trend from 567.74 → 574.53. Fewer trades, bigger R:R, wait for the setup.
Bottom Line for Bella
My thesis was correct (oversold bounce), my direction was right, but my process was OFF-BOOK. 22 trades with no defined stops or targets = reactive trading. If I had applied either the VWAP Pull-In rules (band stops on my entries) or waited for FL2 signals (fewer trades, full confirmation), the outcome on this +3.4% QQQ day would have been dramatically different. The edge isn’t in the idea — it’s in the execution framework.
Please note that the prices and other statistics on this page are hypothetical, and do not reflect the impact, if any, of certain market factors such as liquidity, slippage, and commissions.
QQQ VWAP PULL-IN • VWAP-PULL-IN
SPY CORRELATION
10:20 ET — SPY entry at 641.55 (above UB1). Stopped out 10:42 at LB1 (640.50), −$1.05/sh. EMA 9 flipped from +2.88° to −16.87° (sharp rejection)
11:56 ET — SPY re-entry at 639.95 (below VWAP). Exited 12:06 at UB1 (641.30). EMA 9 reversed −5.57° to +11.82° — bottom confirmed
Timing Match: SPY confirmed the bounce at 12:06. QQQ band strategy entered 8 minutes later at 12:14. Both instruments bottomed simultaneously (~11:40–12:00)
UVXY Signal: UVXY collapsed from 56.55 open to 52.30 close (−14%) confirming the fear unwind was real, not a dead-cat bounce
Please note that the prices and other statistics on this page are hypothetical, and do not reflect the impact, if any, of certain market factors such as liquidity, slippage, and commissions.
QQQ VWAP PULL-IN • VWAP-PULL-IN
DATA-DRIVEN EDGE
How I Used Claude to Analyze This Trade
Pulled all 211 executions from Gr8Trade via KTI CLI, filtered to 22 QQQ trades
Pulled 391 one-minute candle bars and plotted executions on interactive charts with entry/exit markers and cumulative P&L
Queried VWAP band strategy signals from PostgreSQL — found 3 strategy signals with full band geometry (VWAP, UB1-3, LB1-3, slopes)
Calculated Bollinger Bands from 20-day daily data — confirmed oversold bounce at Lower BB. Connected to CMT Chapter 7 RSI framework and Overextension System (inverse setup)
Pulled SPY correlation data — confirmed both instruments bottomed simultaneously (11:40–12:00)
Built “Me vs The Bands” comparison — quantified exactly how much was left on the table
Generated this full playbook with interactive charts, matching the playbook template format
Future: Automated Playbook Generation
This playbook was generated programmatically from trade data, VWAP band signals, and market context. The goal is to automate this for every trading day — real-time execution grading against quantified strategy signals, not just gut-feel reviews. Connect live Gr8Trade executions to the VWAP band strategy database and produce same-day playbook reviews automatically.